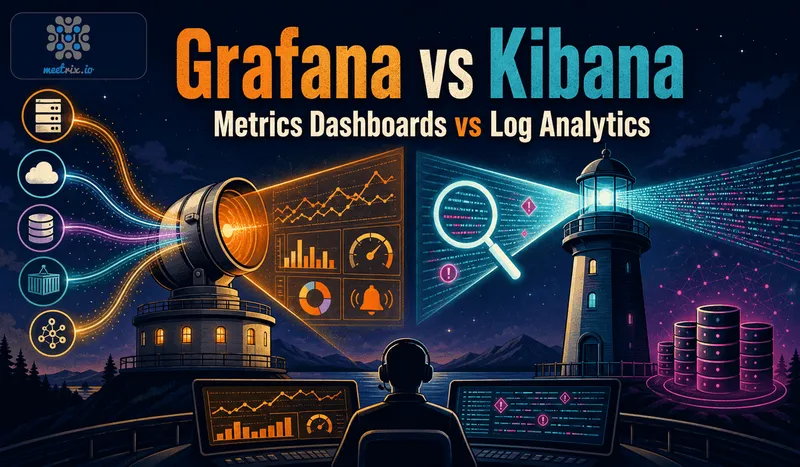
Grafana vs Kibana gets framed as a head-to-head dashboard comparison more often than the architecture actually supports. Grafana connects to dozens of data sources, Prometheus, Loki, Elasticsearch, TimescaleDB, CloudWatch, and shows metrics and logs from whichever backend you're running. Kibana is Elasticsearch's own interface, built specifically for one backend and tuned around it. That's not a small distinction, it decides most of the real-world choice before pricing or panel types even come into it.
Quick answer
Jump to a section
Grafana: a dashboard layer, not tied to one backend
Grafana's core moved from Apache 2.0 to AGPLv3 in 2021, specifically to close the gap that let cloud providers resell it as a managed service without contributing back. The self-hosted OSS edition is free with the full core feature set, panel types, alerting, dashboard variables, and connects to Prometheus, Loki, Elasticsearch, TimescaleDB, CloudWatch, and dozens more data sources from the same interface. Grafana Enterprise adds LDAP team sync, data source permissions, and reporting behind a proprietary license key, features most self-hosted deployments never need.
Key facts
- AGPLv3 core, free self-hosted with no feature restriction on the OSS edition
- Connects to dozens of data sources: Prometheus, Loki, Elasticsearch, TimescaleDB, and more
- Enterprise tier (proprietary license key) adds LDAP sync, permissions, reporting
- Common open source pairing: Prometheus for metrics, Loki for logs
Kibana: Elasticsearch's dedicated interface
Kibana is built specifically for Elasticsearch, and its Discover view for full-text log search and exploration is purpose-built around that one backend in a way Grafana's more general panel system doesn't attempt to match. Elasticsearch and Kibana's licensing has had a genuinely complicated recent history: Elastic moved away from Apache 2.0 to the source-available SSPL and Elastic License in 2021, largely for the same AWS-freeloading reason Grafana Labs cited for its own AGPL move. In August 2024, Elastic added AGPLv3 as a third licensing option, restoring OSI-approved open source status alongside the original two licenses.
Key facts
- Built specifically for Elasticsearch, not a multi-backend dashboard tool
- Discover view purpose-built for full-text log search and exploration
- Licensed under SSPL, Elastic License v2, or AGPLv3 (your choice, since August 2024)
- Client libraries remain Apache 2.0 regardless of which server license you pick
The real difference: agnostic vs coupled
This is the part worth being direct about before comparing panel types or alerting rules. Grafana was designed from the start to sit on top of whatever you're already running, it doesn't care if your metrics live in Prometheus, your logs live in Loki, and your traces live in Tempo, it visualizes all three from one place. Kibana was designed as Elasticsearch's own window into itself, tightly coupled to that one search and analytics engine. Neither approach is wrong, they're solving different problems: Grafana is betting you'll have multiple backends over time, Kibana is betting you've standardized on Elasticsearch and want the interface built specifically around it.
Licensing: a complicated recent history for both
Both projects moved away from fully permissive licensing around the same period, and for a similar reason, cloud providers reselling the software as a managed service without contributing back. Grafana Labs moved to AGPLv3 in 2021 and stayed there. Elastic went further, moving to the SSPL and Elastic License, both source-available but not OSI-approved open source, before reversing course in August 2024 by adding AGPLv3 as a third option. As of today, both projects are genuinely open source again, but the path to get there looked different, and anyone who evaluated either tool during 2021-2024 based their decision on licensing terms that have since changed.
Cost
Both are free to self-host at the software level. Grafana Cloud's free tier covers 10,000 metric series and 50GB of logs with 14-day retention, and Pro starts around $19/month base plus usage ($6-8 per 1,000 active metric series, $0.40-0.50/GB for logs). Elastic Cloud Hosted starts around $99/month with a different pricing model based on deployment size rather than per-series usage. Self-hosting either removes the managed-service cost entirely, at the cost of running and scaling the infrastructure yourself, which for Elasticsearch specifically is a nontrivial operational commitment at scale.
Grafana vs Kibana: feature comparison
| Criterion | Grafana | Kibana |
|---|---|---|
| License | AGPLv3 | SSPL, Elastic License v2, or AGPLv3 (your choice) |
| Data source model | Multi-source, dozens supported | Elasticsearch only |
| Best at | Cross-source dashboards, metrics visualization | Full-text log search and exploration |
| Common open source pairing | Prometheus (metrics), Loki (logs) | Elasticsearch, Logstash (the full Elastic Stack) |
| Managed cloud starting price | Free tier, Pro from ~$19/month + usage | Elastic Cloud from ~$99/month |
| Enterprise features | LDAP sync, permissions, reporting (paid) | Advanced security, ML features (paid tiers) |
Where each one falls short
Grafana
- Log search and exploration is weaker than Kibana's purpose-built Discover view
- Requires configuring and running separate backends (Prometheus, Loki) to get full value
- Some genuinely useful features (LDAP sync, permissions) sit behind Enterprise licensing
Kibana
- Tied to Elasticsearch, no meaningful multi-backend flexibility
- Elasticsearch itself is operationally heavier to run and scale than Prometheus or Loki
- Licensing history (2021-2024) left some teams wary, even though AGPL is back as an option
Grafana vs Kibana isn't a contest with a clean winner, they're built around different assumptions about your stack. If you want one dashboard tool sitting on top of multiple data sources, Grafana's architecture is built for exactly that. If you've already standardized on Elasticsearch for logs and want the interface built specifically around it, Kibana does that job better than a general-purpose tool ever could.
Our Grafana developer guide and AWS launch guide cover the self-hosted setup in full, and our TimescaleDB, Grafana, and Prometheus stack guide covers a complete open source metrics pipeline. If your monitoring needs extend into business intelligence rather than infrastructure metrics, our Metabase developer guide covers that adjacent use case.
Frequently Asked Questions
Grafana vs Kibana: are they solving the same problem?
Not exactly. Grafana is a data-source-agnostic visualization layer, it connects to Prometheus, Loki, Elasticsearch, TimescaleDB, CloudWatch, and dozens more, all from one dashboard tool. Kibana is Elasticsearch's dedicated interface, built specifically for one backend. If you're already committed to Elasticsearch for logs, Kibana fits naturally; if you want one dashboard across multiple data sources, that's Grafana's actual design goal.
Kibana vs Grafana: which is better for log analysis specifically?
Kibana, for pure Elasticsearch log search and exploration, its Discover view and query experience are purpose-built for that job. Grafana can visualize logs too, through Loki or Elasticsearch as a data source, but it's a dashboard tool first, not a dedicated log-search interface.
Are Grafana dashboards better than Kibana's for metrics?
For pure metrics and time-series visualization, most teams find Grafana's dashboarding more flexible, largely because it wasn't built around one specific backend. Kibana can visualize metrics stored in Elasticsearch, but Grafana's panel types and multi-source support are deeper for that specific use case.
What are the best open source monitoring tools to pair with Grafana or Kibana?
For metrics, Prometheus paired with Grafana is the most common open source combination. For logs, Grafana Loki or the Elastic Stack (Elasticsearch, Logstash, Kibana) are the two dominant open source paths, and both are genuinely open source again as of Elastic's 2024 AGPL license addition.
Is Kibana still open source in 2026?
Yes, though the path there wasn't simple. Elastic moved Elasticsearch and Kibana away from Apache 2.0 to the source-available SSPL and Elastic License in 2021. In August 2024, Elastic added AGPLv3 as a third licensing option, restoring OSI-approved open source status alongside the original two licenses.
Does Grafana require Elasticsearch to work?
No. That's the core architectural difference from Kibana. Grafana works with dozens of data sources, Prometheus and Loki are the most common open source pairings, and Elasticsearch is just one option among many, not a requirement.
Launch Grafana on AWS in Minutes
Launch a pre-configured Grafana server on AWS, ready to connect to Prometheus, Loki, or any other data source for your dashboards.
Get Grafana on AWS Marketplace